Fast & precise non-contact 3D measurement of surface details – What would Mr. Lincoln say?
Published on October 28, 2021
Did you know that 3D measurement with interferometry can be highly precise AND crazy fast? This dual capability is critical for in-line inspection in high-precision industries.
To illustrate this capability, we used Novacam SURFACEINSPECTTM 3D metrology system to scan a detail on a US penny. Based on low-coherence interferometry, the system measures with micron precision yet its typical measurement cycle is merely seconds, often satisfying challenging plant-floor applications.
Of course, the measurement cycle time will depend on two parameters: a) the size of the area measured and b) the required density of measurements. For this reason, we compare two measurement scenarios for the same area – one scenario with a high density and another with a lower density of 3D point measurements.
Enter Mr. Lincoln on the back of the US penny
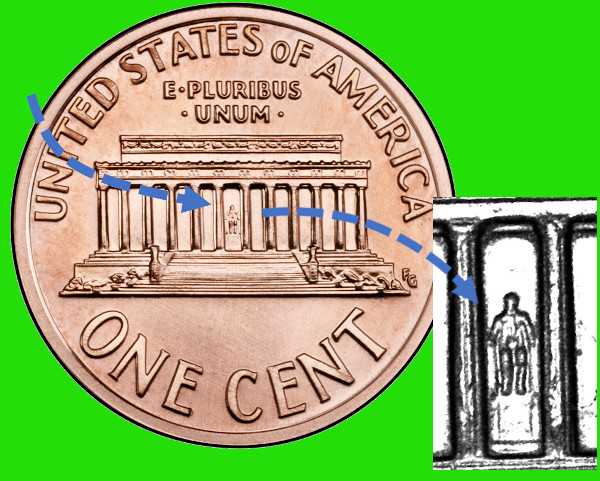
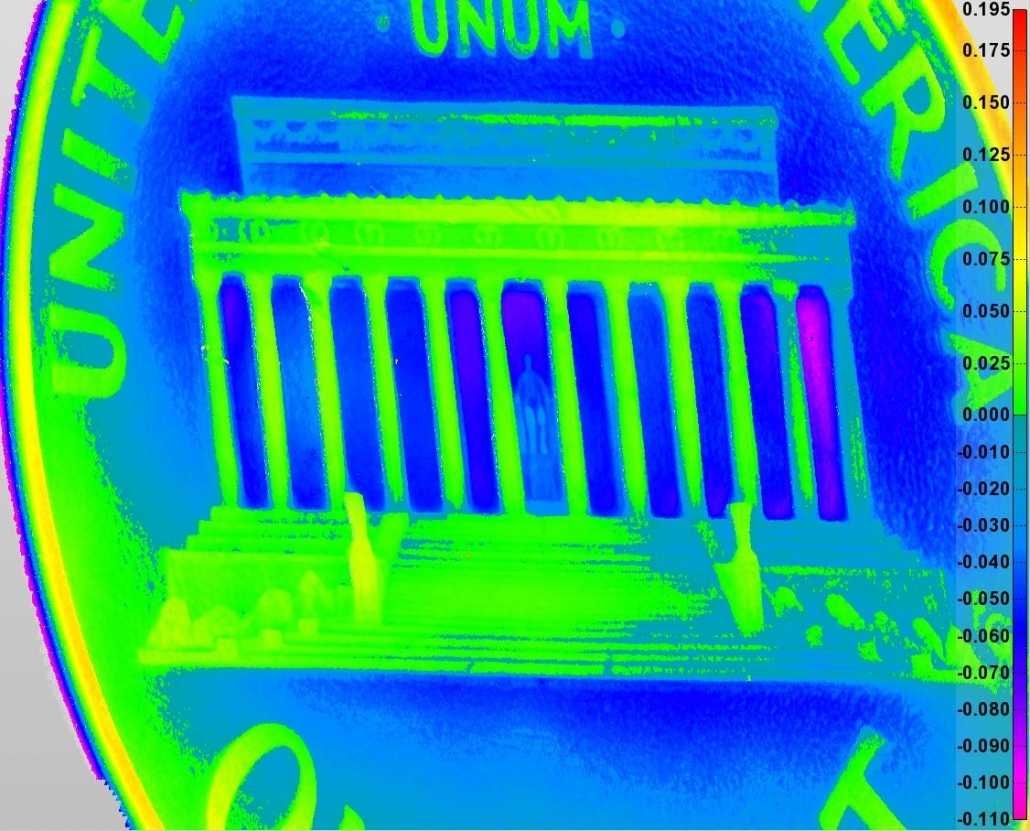
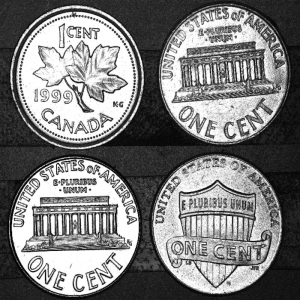
The US one-cent coin is a familiar object in North America. The penny is ~21 mm wide and 1.52 mm thick. The coin has a little-known detail on its back – a tiny figure that is interesting to measure. Most people don’t ever notice it.
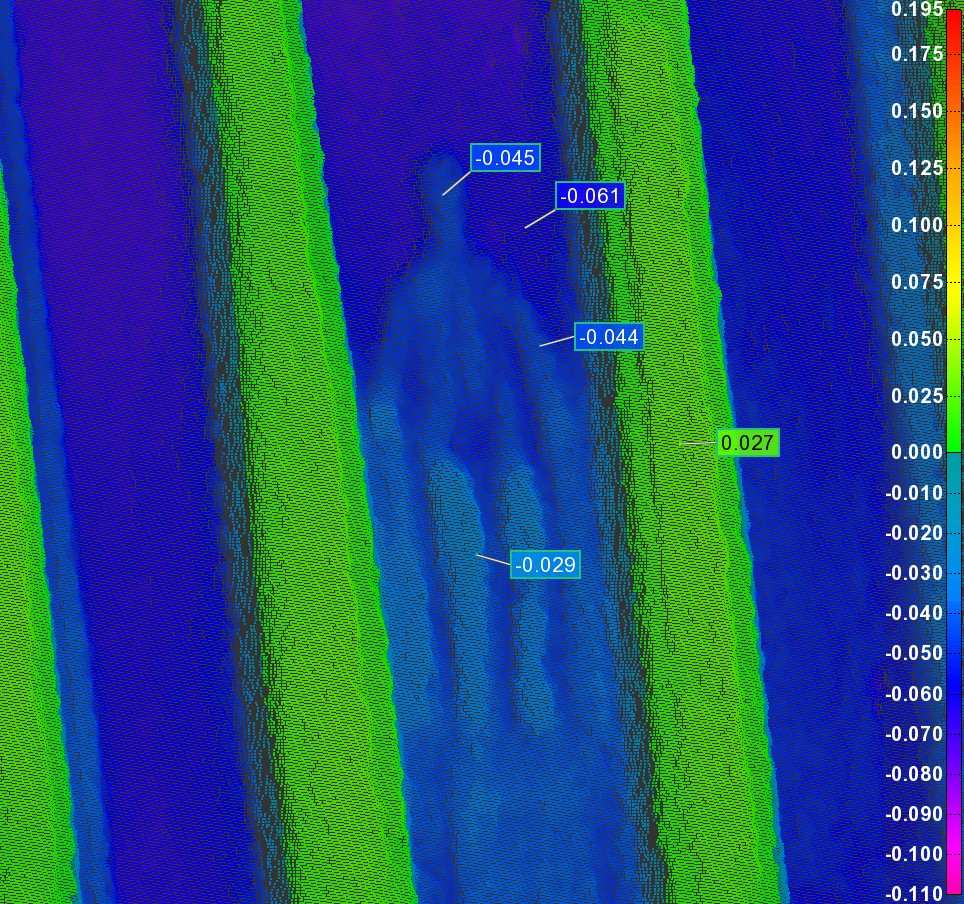
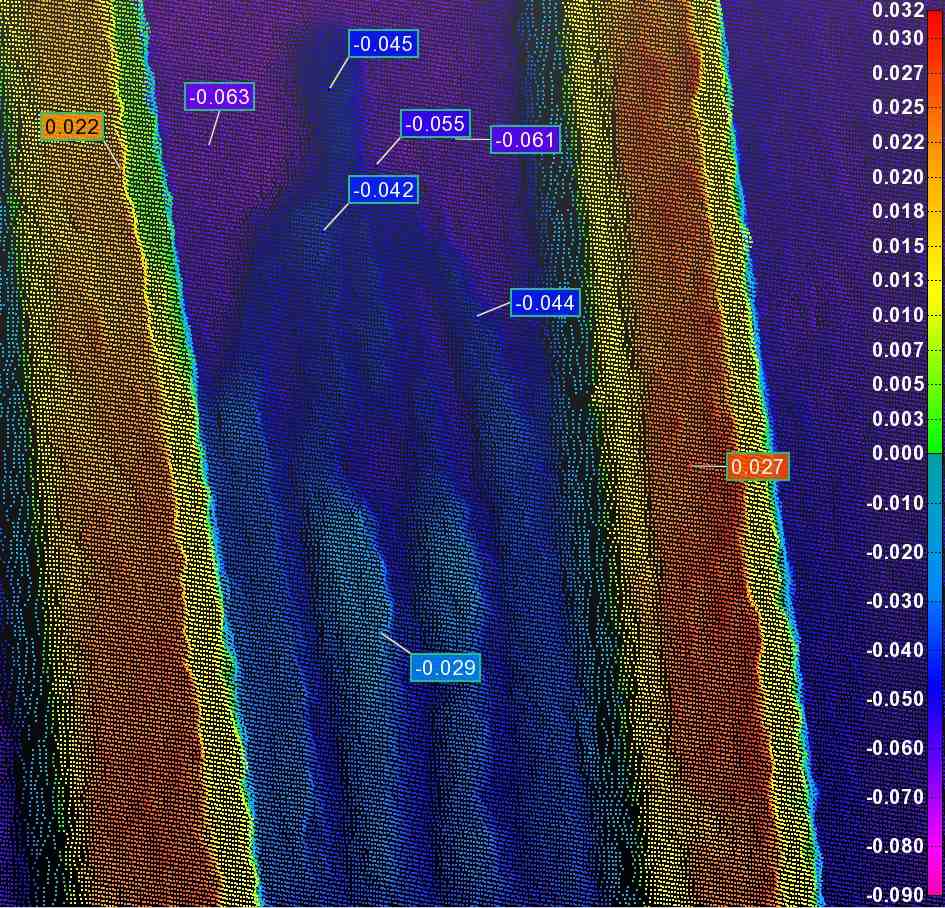
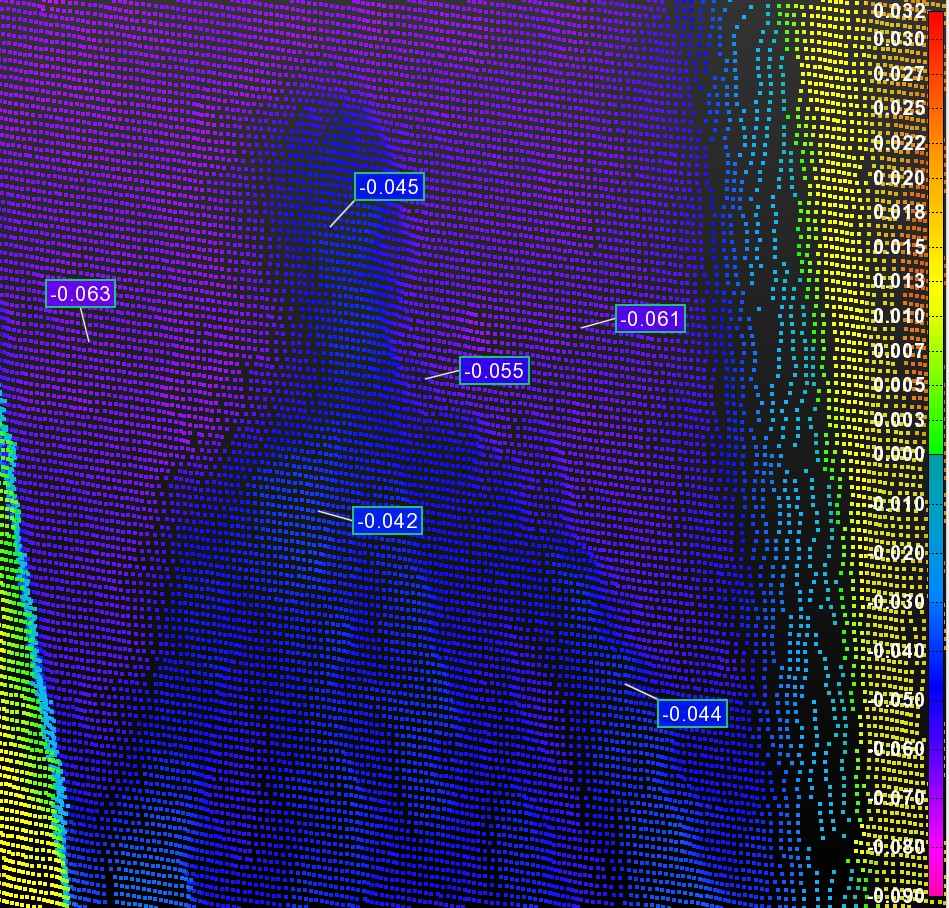
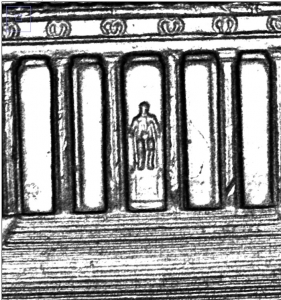
To find the figure, look closely at the center of the Lincoln Monument pictured on the backside of the coin. Between the two central columns, you’ll see a tiny seated figure of Mr. Abraham Lincoln, America’s 16th president. We wanted to measure and visualize the smallest detail – Lincoln’s head, which is approximately 0.25 mm (250 µm) wide and 0.018 mm (18 µm) high.
It has been measured before
Although a feature as small as Lincoln’s head is fast and easy to photograph, it is not easy to measure in 3D. A recent small comparison study illustrated this difficulty by comparing 3 optical measurement technologies:
- a 3D laser line scanner,
- a structured light system, and
- a while-light interferometer.
Interestingly, from the 3 technologies compared in the study, only the white-light interferometry system provided the precision and accuracy that afforded a sharp and artifact-free visualization of the Lincoln figure.
Curiously however, the interferometry technology was judged as slow. The cause of the slowness was the stitching required by the interferometry system used in that study. In fact, this particular system required six (6) area measurements to cover the small surface of the coin!
But is this time-consuming stitching inevitable? And is ‘slow’ a fair judgement of interferometry as measurement technology?
We would categorically say no.
Speeding up optical interferometry
Not all interferometry systems are equal in terms of system design. For example, NOVACAM 3D metrology systems, which use low-coherence interferometry, achieve axial precision of <=1 µm, yet they measure much faster than the white-light interferometry system used in the study mentioned above. The speed advantage is due to system design. Since Novacam targets high-precision industrial applications, the company has pushed and progressively fine-tuned the performance of its systems to provide:
- point-by-point surface acquisition at up to 100,000 3D points per second, and
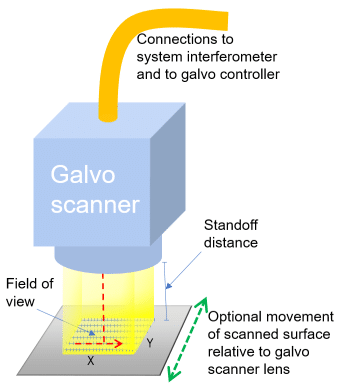
- the option of fast-scanning area probes, such as raster-scanning galvo scanners, with a field of view (FOV) of up to 84×84 mm (standard models). Larger FOVs are available in custom models.
Within the galvo scanner FOV, the scanning beam traverses the surface extremely fast in a line-by-line raster pattern, rapidly providing a 3D point cloud for the specified area within the FOV. When the area to be measured fits within the FOV, stitching is not required. The measurement time then largely depends on the user-specified density of data points.
To show the relationship between the data point density and the resulting scan time, we ran a couple of scan scenarios.
Cycle time scenarios
Let’s get back to Mr. Lincoln on the US penny. To measure the backside of the coin, we used the SURFACEINSPECT 3D metrology system with a lens FOV of 54 x 54 mm, a working distance (standoff) of 125 mm, and a spot size of 6 µm (FHM).
We scanned the coin twice: once at a high density and once at a lower density. The table here shows the results associated with the two scans.
| Scan 1: high-density scan | Scan 2: low-density scan | |
|---|---|---|
| Area scanned | 25 x 25 mm | |
| Standoff | 125 mm | |
| Point density in X&Y direction | 6 µm | 37.5 µm |
| # of data points per scan line | 4,167 | 666 |
| Total # of data points | 17,363, 889 | 443,556 |
| Cycle time | 5.8 min | 9 sec |
As shown in the table:
- Scan 1, a high-density scan, involved acquiring a 3D point measurement every 6 microns. It provided over 17 million data points and took several minutes. To note, very few of our industrial clients require this many measurements.
- Scan 2, a lower-density scan, involved acquiring a measurement every 37.5 microns. It provided close to 1/2 million data points in 9 seconds. This scan represents a more typical density of points required by our industrial clients. Even much lower density than this one often suffices for 3D geometry analysis.
To be sure, with NOVACAM 3D metrology systems, users may experiment with and select the acquisition point density that meets their needs. In general,
- Geometry measurements require low-density 3D point clouds, while
- Identifying and measuring the smallest of defects requires the highest density 3D point clouds.
Analysis and visualization of the 3D data
Following an area scan, the SURFACEINSPECT system users may view the 3D data in 3 different ways.
1) As a 3D point cloud
The 3D point cloud provides the basis for either interactive or automated 3D geometry analysis with 3D GD&T software. If the point density is high enough, the 3D point cloud can be also used to identify and measure defects.
Use arrows to zoom into the 3D point cloud of the penny.
Novacam provides PolyWorks Inspector software for 3D GD&T analysis as an option with its 3D metrology systems.
2) As a Light intensity map
The light intensity map from a high-density scan is equivalent to a photo obtained by a vision system. Though it does not contain data, the light intensity map is a helpful visual reference, particularly for identifying defects.
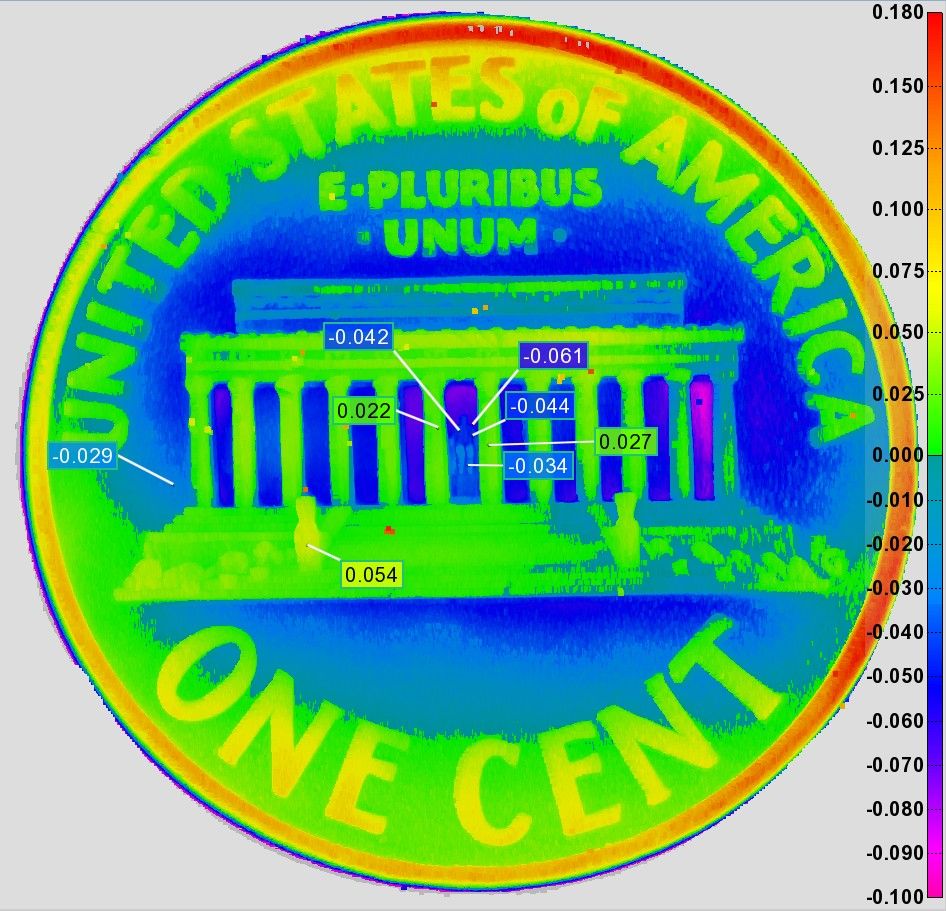
3) As a Height map
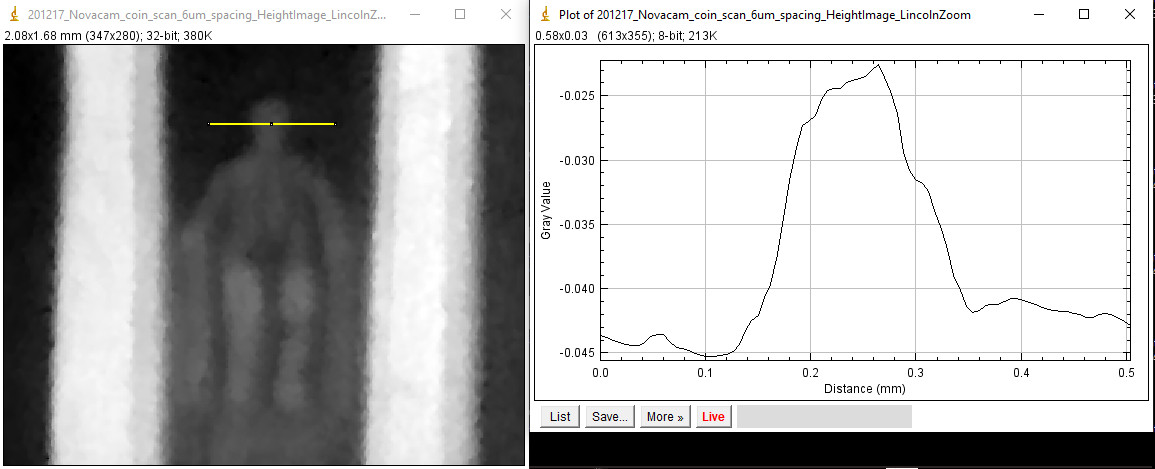
The height map represents the micron-precision height value of each measured point of the surface. This format of the 3D data can be interesting for both interactive or automated analysis of surface features or defects. For example, as shown, a linear profile (indicated by a yellow line) on the penny surface height map provides the exact measurements of the height of Lincoln’s head and the columns on either side.
Is one penny enough? How about more?
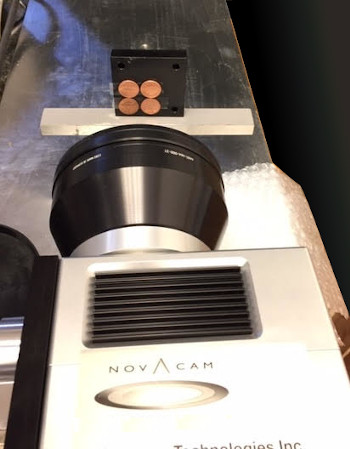
The galvo scanner FOV is selected based on the application need. For example, with an adequate FOV, the SURFACEINSPECT system may scan several pennies in one pass as shown below.
Where are high-precision and high speed needed?
The combination of measurement precision and speed is required by many manufacturers in high-precision industries. In many of these industries, NOVACAM 3D metrology systems (including the SURFACEINSPECT and EDGEINSPECT, for example) measure geometry, defects, and even thickness of semi-transparent materials.
Here are a few typical industrial applications:
- Semiconductors – wafers, CMP pads
- Aerospace – aircraft rivet countersinks, airfoils, jet engine turbine blades, cooling holes
- Automotive – fuel injector seats, valve bodies
- Glass industry – multi-layer thickness measurement, smartphone glass
- Ophthalmology – regular or intraocular lenses
- Plastics – extruded fibers or tubing
- Bio-medical – tissue thickness, surface-finish or thickness of implants (e.g., catheters)
- Nuclear – nuclear fuel rods
- Metallurgy – weld inspection.
More than speed & precision
In addition to speed & precision, Novacam SUFACEINSPECT & EDGEINSPECT galvo scanning systems offer unique capabilities such as:
- Ability to acquire dimensions, defects and thickness with the same instrument
- Standoff distance (up to 215 mm) and FOV that enable industrial deployment (unlike microscopes)
- Ability to measure blind hole bottoms (such as injector seat measurements) or hard-to-reach areas (with mirrors, for example)
- Area or strip scanning even in hard-to-reach spaces such as bores and cylinders with new periscope-like galvo scanners
- Ability to perform continuous (long strip) scanning by combining the galvo scanner with a motion stage
- Measurement in hostile environments involving extreme temperatures, extreme pressures, or radioactivity.
With NOVACAM 3D metrology systems, scan definitions can be optimized to meet each application’s measurement and cycle time requirements. Also, scan definitions, which include measurement sequences and data analysis, are user-customizable. Moreover, NOVACAM systems support full automation of the inspection-analysis cycle.
Read about other advantages of NOVACAM technology here.
What would Lincoln say?
Of course, we don’t know what Mr. Lincoln would say. But we can speculate that, as a strong proponent of constant learning, he would also approve of pursuing technological advancements that improve the capabilities of the day’s manufacturers. NOVACAM systems, which offer non-contact high-precision 3D measurements combined with high-speed acquisition, strive to do just that.
