
What kind of data do Novacam 3D metrology systems generate?
Published on December 12, 2019
This is a valid question when evaluating any 3D metrology solution. What data will it give me? And what’s the utility of that data?
This article presents the 3 types of data generated by Novacam non-contact 3D metrology systems (the BoreInspect, TubeInspect, SurfaceInspect, EdgeInspect and Microcam Profilometer). Deployed across high-precision industries, the systems simultaneously generate a 3D point cloud, a light intensity map, and a height map from each scan.
The three data sets may be used separately or in combination to:
- provide micron-precision measurements of dimensions (GD&T) and surface quality parameters, and
- offer unprecedented insight into our clients’ manufacturing processes.
Click on images for close-up view
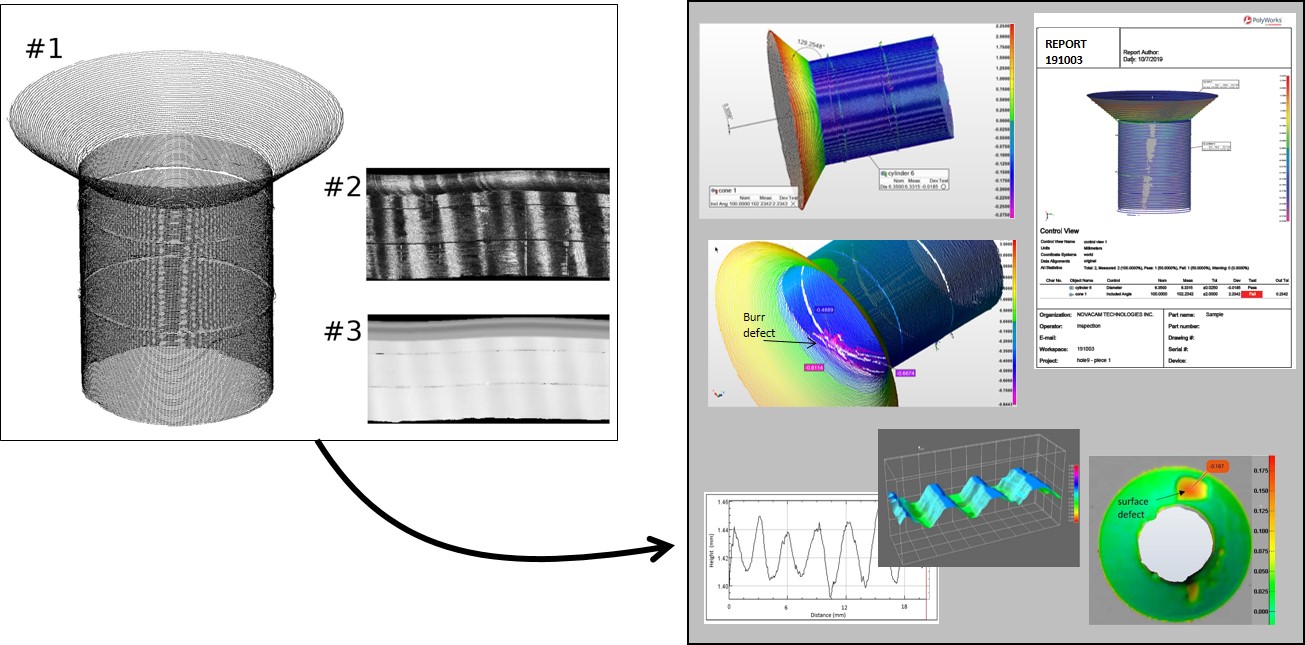
The 3 types of data generated by Novacam 3D metrology systems provide a solid basis for rapid automated dimensional measurements, for defect detection and measurement, interactive visualization, and more.
First, a quick intro to the technology and mode of measurement with the systems.
Intro to technology and mode of measurement
Novacam 3D metrology systems are based on low-coherence interferometry. They acquire surfaces in a non-contact point-by-point manner: a fiber-based optical probe directs light onto the measured surface and collects reflected light signals, which are then processed by the system’s Microcam-3D/4D interferometer.
Depending on the interferometer model, up to 100,000 3D point measurements are acquired per second. For example, a 10 second scan with a system that uses a Microcam-4D interferometer generates 1 Million 3D measurement points along a user-set scan path.
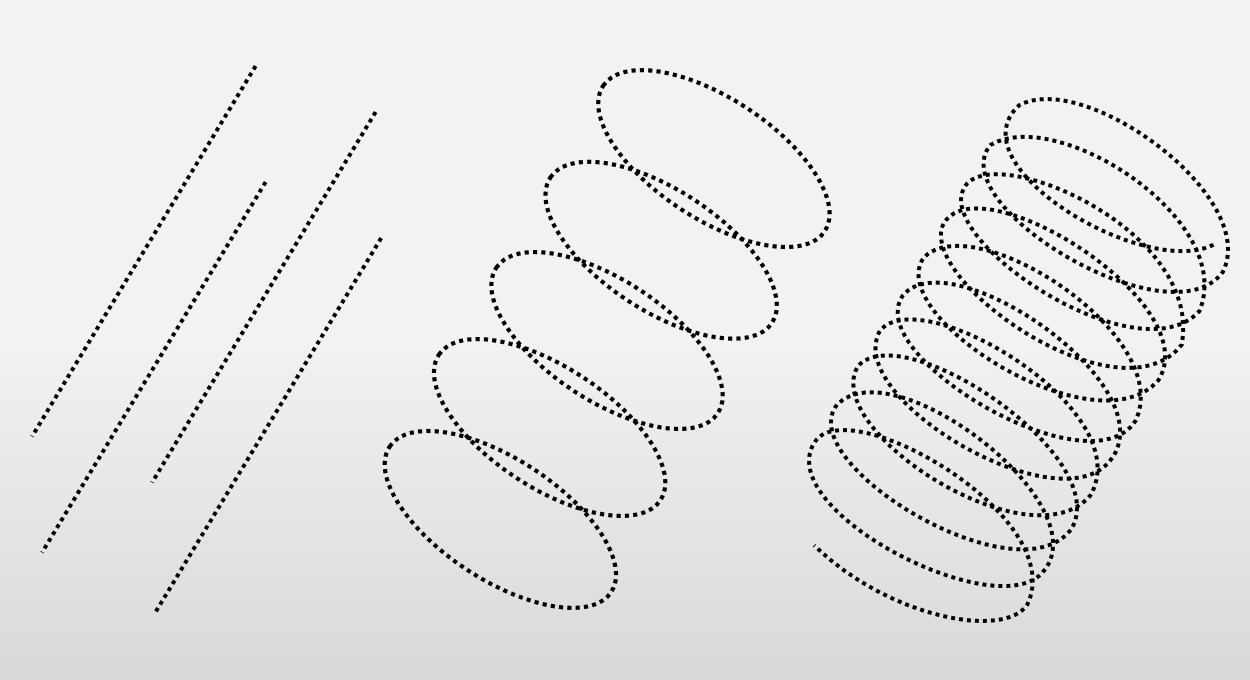
A scan path is typically linear, circular, or spiral.
Novacam acquisition software allows users to automate the measurement cycle, including scanning, data analysis, and subsequent reporting. To automate these repetitive tasks, users configure scan definitions, which comprise measurement sequences and subsequent reporting.
Scan definitions are invoked automatically by a PLC (programmable logic controller) or by an operator with the push of a button. In this way, the inspection cycle and the measurements obtained are independent of the operator.
Example of a scanned object – a drilled fastener hole
For a concrete illustrative example of the data generated, we scanned the inside diameter (ID) surface of a 6.25 mm (¼”)-diameter rivet hole drilled through a stack of 3 aluminum plates. The total plate stack thickness is about 9.4 mm (3/8”)), and the rivet hole has a 100 degree (nominal) countersink at the top opening.
To measure, we used Novacam BoreInspect 3D metrology system equipped with a 3.05 mm diameter rotational probe.
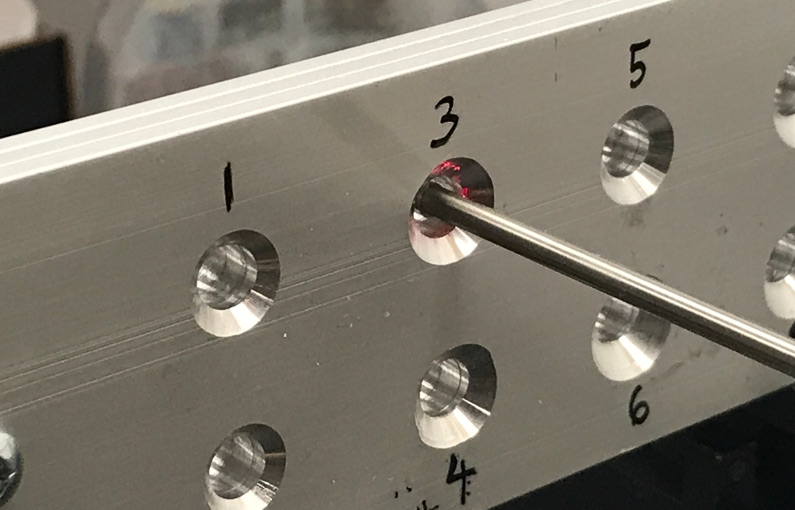
To measure the ID of a 6.35 mm (¼”) rivet hole, we used the BoreInspect 3D metrology system equipped with a 3.05 mm diameter rotational probe.
We selected a spiral scan path and then we scanned the hole twice – once at a high density (with a very small spiral pitch) and once at a lower density (with a larger spiral pitch).
Please see the diagram for a definition of a spiral pitch.
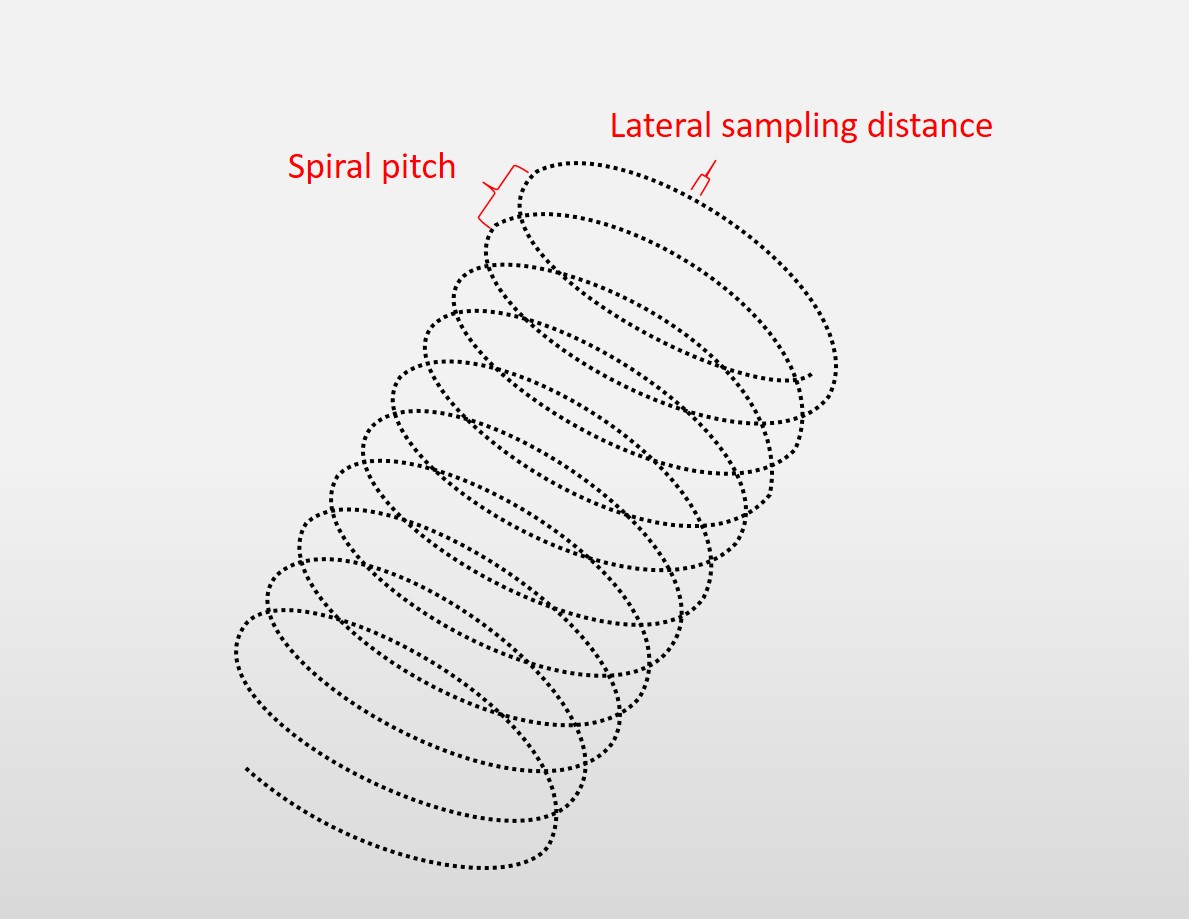
The pitch of the scan spiral is a partial determinant of the speed of an ID scan. The other is the rotation speed of the probe.
Data set #1: 3D point cloud
The first type of data generated is a 3D point cloud, which is a set of data points associated with X,Y,Z coordinates. It represents the set of points measured on the object surface and in effect describes the surface in a 3D space.
As mentioned earlier, with Novacam 3D metrology systems, the path of the scan and the density of the point cloud is set by the user depending on their measurement needs. Here below we show two point clouds – one generated from a high-density spiral scan and the other from a lower-density spiral scan of the same rivet hole.

To acquire this high-density 3D point cloud of the rivet hole ID, the spiral pitch of acquisition was set to 0.05 mm (~2,000 µin.). The scan took 9.5 seconds and the point cloud comprises over 947,000 3D measurement points. High-density scans are typically required to detect and measure small defects.
To speed up the scan, the spiral pitch was increased to 0.4 mm (~0.016”). This scan took 1.2 seconds and the generated 3D point cloud comprises 118,448 3D measurement points – more than enough for extracting GD&T (dimensional) geometry parameters.
3D point cloud data is most often used for rapid dimensional measurements. The cycle time of scanning and 3D data analysis may be optimized to support automated inspection even in high throughput manufacturing.
Extracting dimensional measurements from a point cloud
The 3D point cloud is output as a data file that is analyzed interactively or automatically using CAD/GD&T (computer aided design/geometric dimensioning & tolerancing) software. Novacam offers PolyWorks InspectorTM, an industry-standard third party CAD/GD&T software, as an option with our 3D metrology systems. The software provides powerful capabilities for evaluating 3D point clouds with respect to user-defined criteria (nominals and tolerances) or a reference CAD model.
PolyWorks Inspector offers both interactive 3D visualization and analysis, and fully automated analysis and go-no-go reporting. Users may define their own macro-based rivet inspection reports. With automated rivet inspection reports, no operator input is required.
Depending on the part and the scan system configuration being used, dimensional measurements may include distance (length, height, width), diameter, angle, straightness, flatness, circularity (roundness), cylindricity, profile of a line, profile of a surface, angularity, perpendicularity, parallelism, position, concentricity, symmetry, circular runout, etc. See the list of dimensional measurements, along with examples of such measurements carried out by Novacam 3D metrology systems.
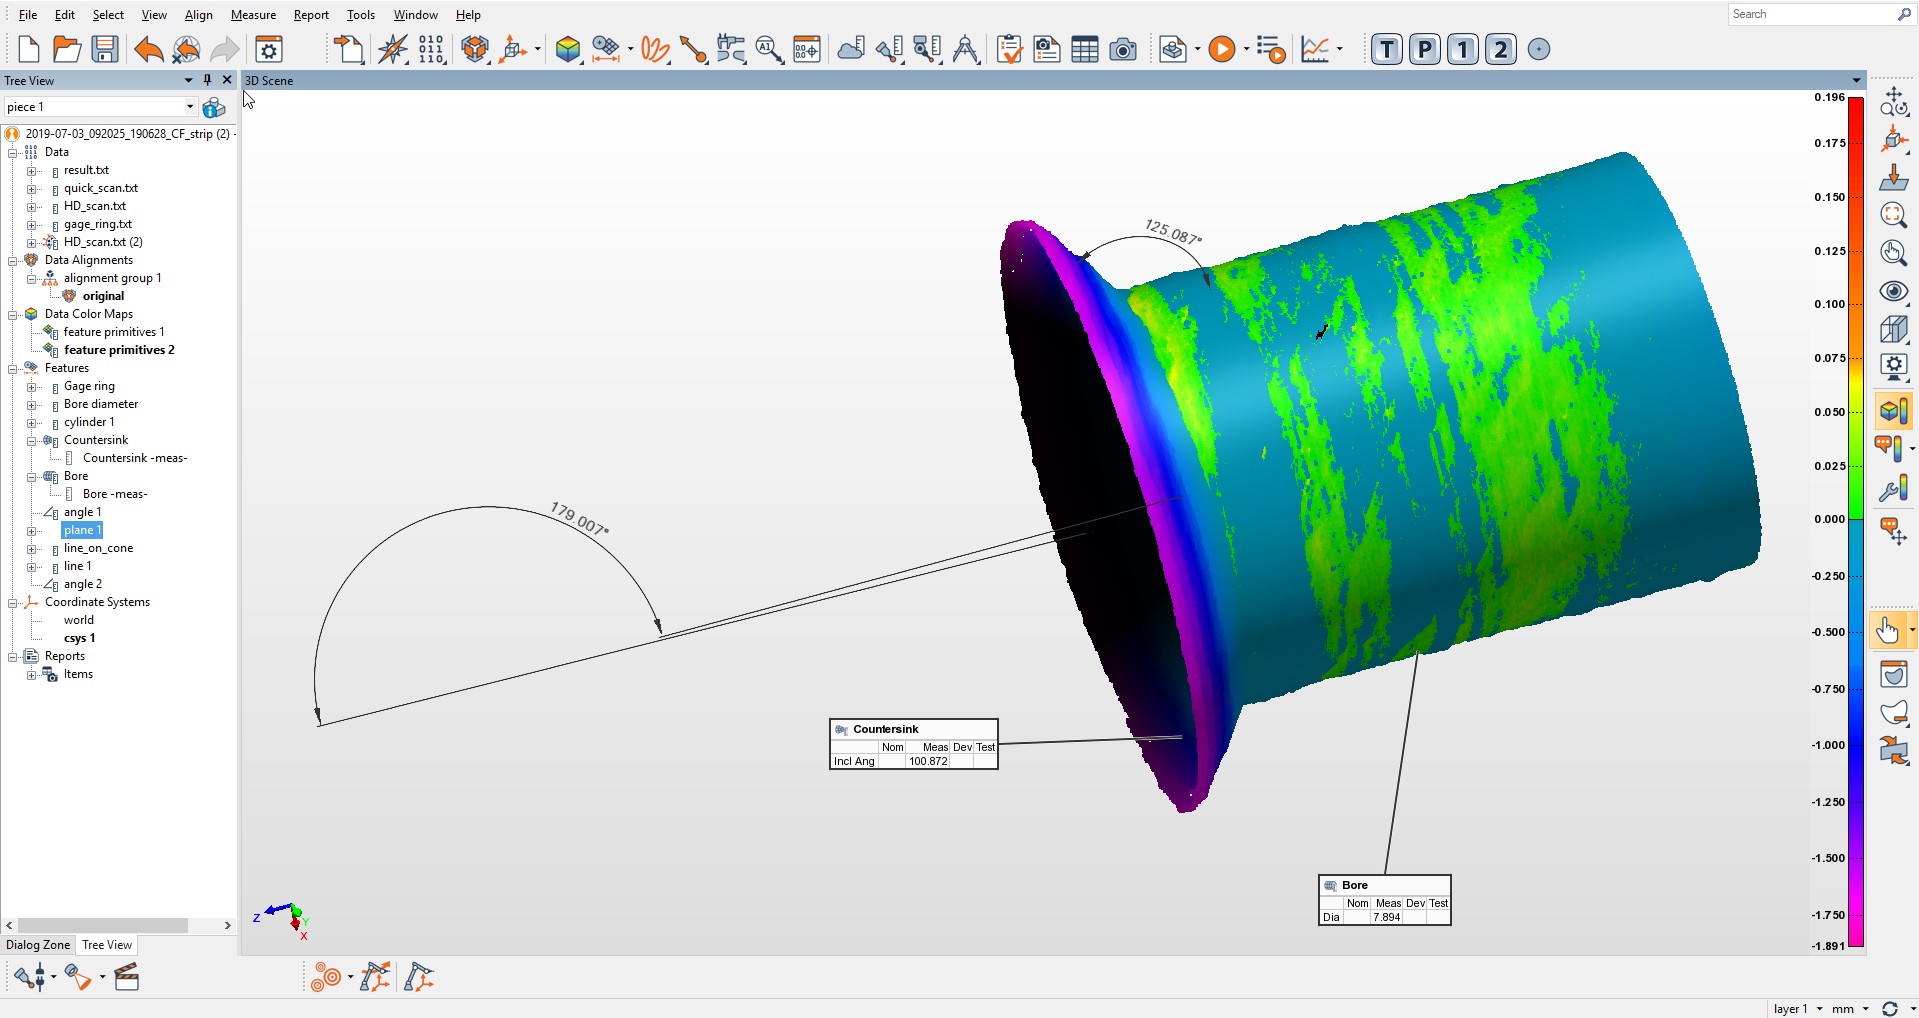
Angle measurement of the rivet hole 3D point cloud carried out in PolyWorks Inspector software.
Detecting and measuring defects
Using the PolyWorks Inspector, users may view the 3D point cloud interactively to examine and measure defects. Continuing on with our example of the rivet hole, we can easily see two types of defects on the inside diameter:
- a burr defect between the countersink and the rivet hole and
- inter-laminar gaps, i.e., gaps between the 3 drilled plates.
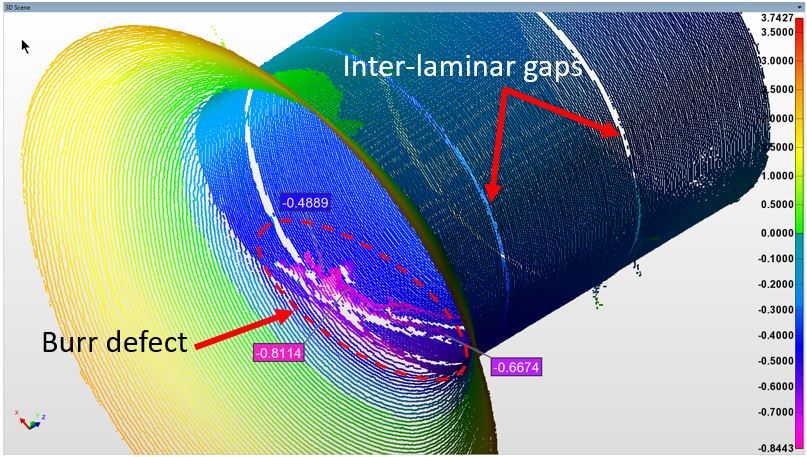
Interactive defect inspection and measurement of rivet hole defects using PolyWorks Inspector software.
The point cloud may also be analyzed programmatically, automating detection and measurement of defects of pre-specified sizes and shapes.
With Novacam 3D metrology systems, defect detection (interactive or programmed) may also be greatly facilitated by using two additional data sets created by the systems: the height maps and light intensity maps.
Data sets #2 and #3: Light intensity map and height map
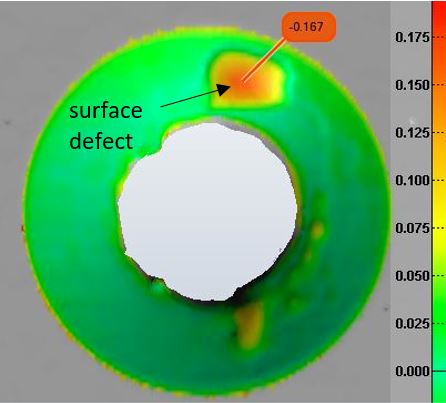
The light intensity and height maps are generated at the same time as the 3D point cloud file. These maps represent an unwrapped view of the scanned surface and are typically very useful for inspecting and measuring defects.
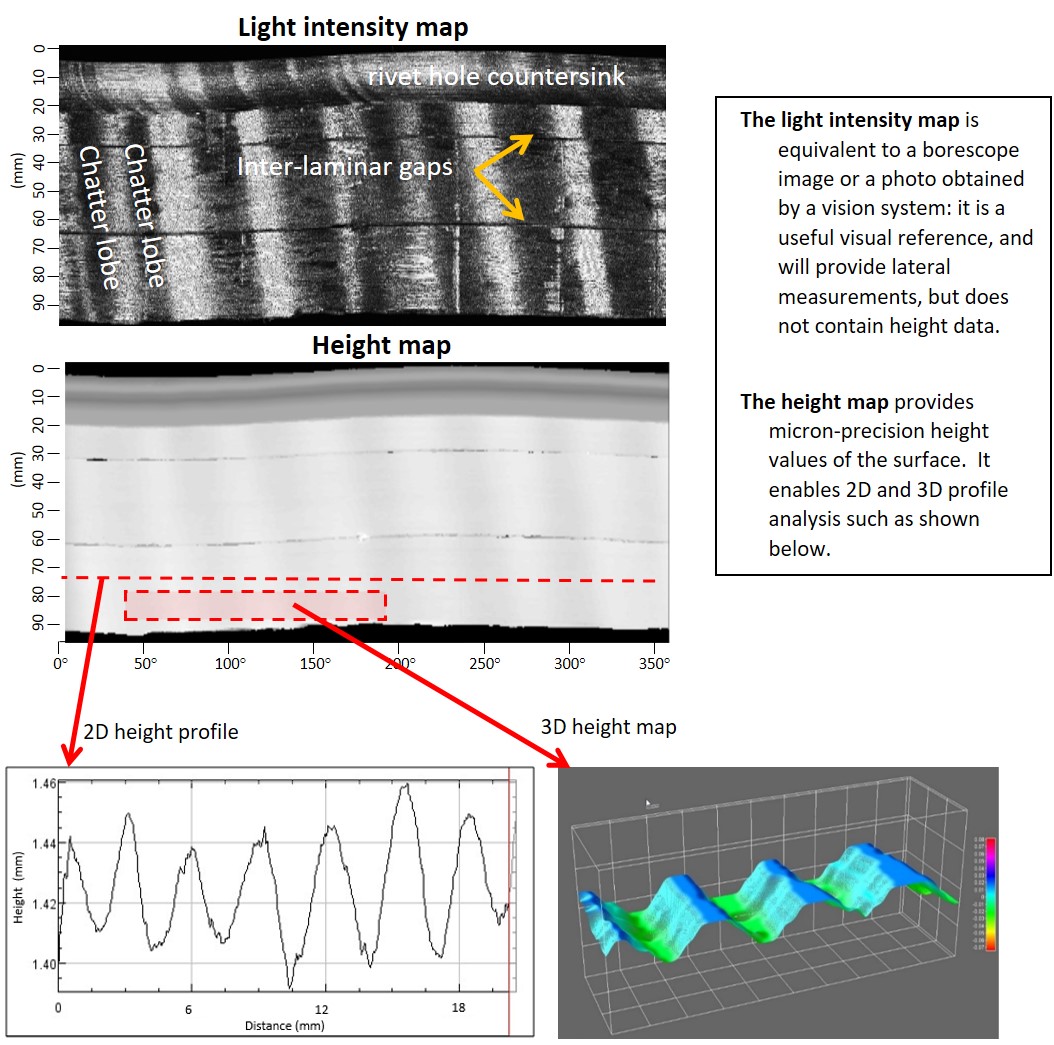
- The light intensity map is equivalent to a borescope image or a photo obtained by a vision system: it is a useful visual reference, and will provide lateral measurements, but does not contain height data.
- The height map provides micron-precision height values of the surface.
As seen in our rivet hole example, a particularly pronounced chatter defect (a pattern of surface waves) shows on the inside diameter. Chatter may be measured based on the 3D point cloud but visually it did not stand out in that particular data set. In contrast, both the height and light intensity maps show the pattern of the 7-lobe chatter clearly as diagonal stripes.
The two maps also show the inter-laminar gaps. These gaps can be measured here as well as in the 3D point cloud data sets.
Click on image for close-up view
In addition to 3D point cloud data, the light intensity map and the height map facilitate defect analysis
The height and light intensity maps are output as 2 separate data files. Both may be viewed using publicly available ImageJ software supplied with Novacam 3D metrology systems. The two maps can be very complementary when used together; features or defects that stand out visually on the light intensity map may be interactively quantified through 2D or 3D measurements extracted from the height map using ImageJ. The two data sets may also be analyzed programmatically.
An alternate format of the 3D data – STL (mesh)
We occasionally get asked – can you produce a mesh from the scan? The answer is yes.
A mesh is a representation of a 3D object using a set of polygon surfaces. It offers a continuous view of 3D measurement data, much like stretching a skin over the measured 3D points.
Novacam data acquisition software provides the option to export scan data directly in STL format, which is a mesh representation of the scanned surface where all polygon surfaces (facets) are triangular. Alternately, the PolyWorks Inspector software may be used to mesh 3D point cloud data and export it in STL format.
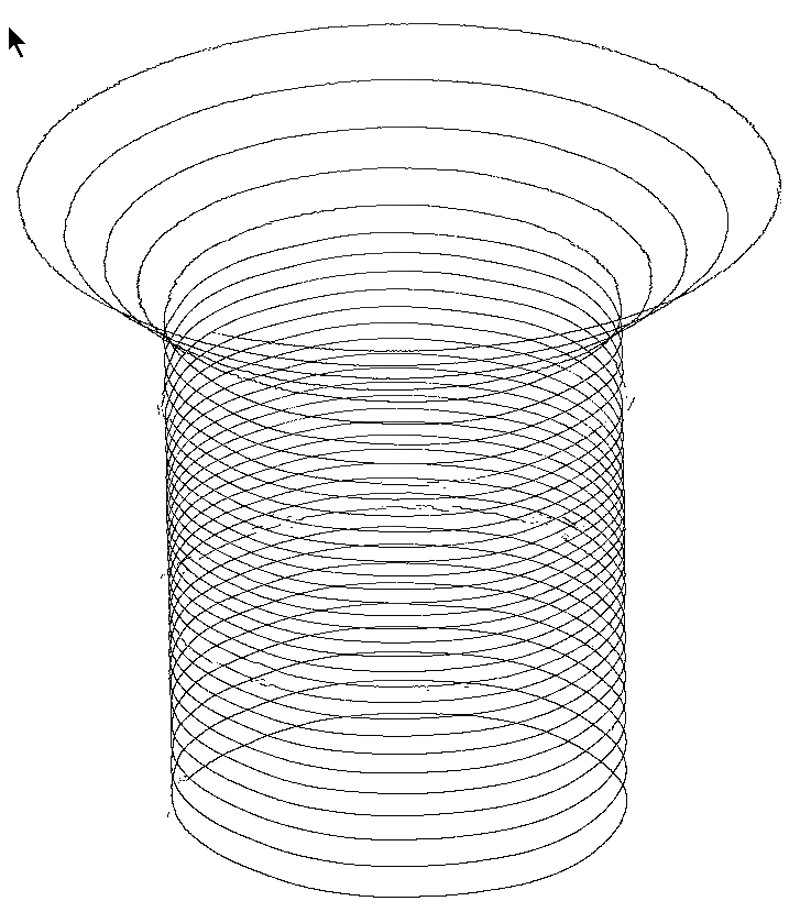
The shown image of an STL mesh was generated from a scan of a rivet hole countersink using Novacam SurfaceInspect system.
The mesh view of the countersink offers a continuous view of the 3D surface.
Do you require more info?
We’ve introduced the 3 main data sets provided by Novacam 3D metrology systems and presented their most common use in dimensional and defect measurements.
To learn more, please contact us – it’s our pleasure to discuss your 3D measurement needs.